 |
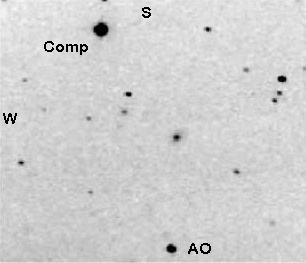
This cataclysmic variable is a CBA target star that Lew is collecting light curves on. The star is noteworthy for the 14 minute (859 second) spikes in the light curve which seem to appear more and less prominently throughout the 3.59 hour period of revolution of this binary star. The comparison star (labeled "Comp") is GSC 5238:0462 which is listed by GSC as magnitude 12.1 and at 11.2 by USNO A2 (ID: 0825-19811053) Several distant galaxies are visible in the frame. |
These light curves were collected on UT dates October 8, 9, and 10, 1999.
Stan Walker - CBA Awanui (corrected my spelling and writes "Incidentally the village is AWANUI - ahwahnooee if you don't know Maori. I'm at a place called Waiharara, about 150 metres from the site of the old Wharemaru Pa (village?) burnt out by a local warlord - Hone Heke - in the 1820s") - in New Zealand observed AO Psc on October 15, 1999. Here is his curve:
Lew's and Stan's data from the next night:
Note: Stan's values have been systematically adjusted by an arbitrary amount of 1.4 magnitudes to align with Lew's in this combined curve. Stan began observing around 25 minutes after Lew finished for the night.
There are some systematic differences between the curves. Lew's data shows a greater apparent amplitude of the spikes and also shows somewhat greater scatter. The differences are partly due to Lew using a shorter exposure (16 seconds) which will catch the swings in brightness as the flickering is going on, and the short exposures add somewhat to the noise in the data, as photon counting statistics are poorer with the shorter exposures. Differing photometric systems also account for some of the differences.
Note in the curves how the amplitude of the spikes from the reprocessed X-rays from the rotation of the white dwarf - the 14 minute period - change over the orbital cycle of 3.59 hours (that is 0.15 days in the scale of the charts).
Full analysis of the data will be done in the future as Lew's and Stan's light curves are combined with those of the other CBA observers around the world. Here are Joe Patterson's preliminary results from the CBA website:
"Very large pulsation signals at 858.7 and 805.2 s. The usual signatures of DQ Her stars. Smooth orbital modulation at 0.1496 d. Also fairly standard. Strong superhump at 0.1661 d. I agonized greatly about this because it was very close to 6.000 c/d, and reached maximum suspiciously close to meridian passage over Tucson. But Lasse's and Stan's data from greatly different longitudes established its reality.
"Weak pulse at w-Wsh, the low-frequency "apsidal sideband" of the rotation (X-ray) frequency. What a horn of plenty it is!"