High speed CCD Photometry was conducted at CBA (California) on 17 nights in the summer of 1999 on MV Lyr in its high state. Considerable flickering was observed as were changes in brightness on a time scale of hours and days. Period finding analysis determined several periods present over this time, including periods of 5.23 min., 48 min. and 227 min but no signal existed at the published orbital period of 191 minutes. Averaged phase diagrams on the periods examined are presented.
MV Lyrae is a nova-like cataclysmic variable star with visual magnitude ranges of 12.5 to 18. It has rapid smaller variations in brightness, spending most of its time in a bright state above magnitude 15. Photometry of MV Lyrae was conducted in the summer of 1999 from the Center for Backyard Astrophysics (California) station. The star was in its "bright state" at visual magnitude 13. Over 10,000 measurements were made during 80 hours on 17 nights during the summer of 1999. During this time the star showed rapid variations in brightness in addition to slower changes over hours and days.
The Center for Backyard Astrophysics (CBA) is an organization of observers with small to medium size (20 cm to 71 cm) telescopes with CCD cameras and professional observatories. CBA conducts routine monitoring and occasional intense photometric campaigns of interesting stars. MV Lyrae was a target star for the group in the summer of 1999. Results reported here relate to only one station's (CBA - California) data. Other data from the combined effort will be analyzed later.
The CBA California 44 cm f/4.5 Newtonian reflector was used for this data collection series equipped with a Cookbook 245 camera (Berry et al, 1994). To maximize the count rate and improve the photometric statistics, the camera was used with a clear filter. Exposures of 16 seconds were collected, allowing the short term variations of the star to be seen. Exposures were collected in strings of 11 frames with positioning checks and occasional dark frame sequences following. Guiding errors were corrected between sets. Frames were dark corrected and flat field corrected. Differential magnitudes were calculated using GSC 3132:01048 as a comparison star. GSC 3132:01412 was used as a check star, however it is suspected of variability according to the AAVSO chart. Observed variability of this check star was minor over a single night. Images were measured using the Photomet photometry program by Richard Berry. Heliocentric time corrections were applied when data from more than one day were examined.
The commonly accepted model for cataclysmic variable stars like MV Lyrae consists of a binary star system where at least one of the stars is a white dwarf (WD) and the other star is usually a late main sequence star. This main sequence star is similar to the sun (or a slightly later spectral type). Mass flows away from the larger secondary star which fills its gravipotential surface in the binary system. It loses mass through the point in the system between the stars where the gravitational forces of the two stars is equal, termed the inner Lagrangian point. Some of the mass lost from the secondary star is captured in a disk or ring of gas that encircles the WD (Figure 1). The point of impact of this material onto the edge of the disk causes a bright spot to form due to the heating from infalling mass. From the disk, material is accreted onto the WD. The energy from accretion generates very hot, bright regions just above the surface of the WD. Magnetic fields may channel the infalling matter into an "aurora" on the WD. Instabilities in the disk may give rise to a bright state which can be quasi-periodic in the case of dwarf novae or continual in the case of nova-like variables.
Prior work by others (Skillman et al, 1995) found much about the system. The masses of the stars in MV Lyr are 0.7 and 0.3 solar masses for the WD and secondary star, respectively. They established the binary period at 0.1329 +/- 0.0004 d. They also determined the orbital inclination to be only 11.5 degrees. They found evidence of a superhump, previously reported by Borisov (1992) at a period 3.7 per cent greater than the orbital period. Superhumps, a defining feature of the SU Ursa Majoris stars, are also common in nova-like variables. Much work has been done on this phenomenon by CBA observers (see e.g. Patterson et al, 1998).
The low 11.5 degree inclination means we are looking at the binary system from near the pole of the orbit as illustrated in Figure 1. This perspective is why we do not see eclipses in MV Lyrae, such occur in eclipsing dwarf novae like IP Pegasi and U Geminorum. These eclipses allow a unique look at the distribution of light emissions in the system from which brightness maps of the disk can be computed. In systems of moderate inclination, the changing aspect of an elliptical disk and a pear-shaped secondary star will lead to superhumps and periodic variations. Even in moderately inclined systems without eclipses, analysis of the light curve can detect the orbital period, the rotation of the elliptical disk and even a disk wobble which leads to the determination of the mass of the secondary star.
At its low inclination, MV Lyr always presents nearly the same appearance to us. This low inclination will prevent us from seeing light variations caused by the orbital revolution of the stars as they eclipse features in the disk and each other, as interesting and useful as those eclipses and other orbital light variations might be. Instead, it allows us to see more clearly the changes which are dynamic, caused by processes which generate light or those which illuminate different areas of the disk at different times as the somewhat elliptical disk precesses and wobbles. Changes in brightness due to the changing aspect presented to us by orbital revolution of the system should be on the order of 0.03 magnitude or less. Changes larger than this must arise from other causes. These would include light variability due to variations in the mass transfer into or out of the disk, physical processes in the disk, variation in illumination of the disk by the stars as the disk changes in size or orientation with respect to the two stars, rotation of the white dwarf and interactions of the magnetic field of the white dwarf with the disk and mass being transferred.
The light curve of MV Lyrae does show rapid flickering during which times the star increases and decreases in brightness by 0.4 magnitudes or more in less than 20 minutes. Flares like this are common and are readily apparent in the plotted observations here and elsewhere. They occurred several times per hour and have been reported on by Kraicheva et al (1999). In addition to the flares, other cyclic variations are discoverable. Pavlenko and Shugarov (1999) reported quasi-periodic oscillations with typical periods of 19, 29, 47 min (0.013, 0.020, and 0.033 day), light variations at 0.1294 days (or its 1-day aliases) and amplitude around 0.1 magnitudes and flickering. The orbital period of the system is 0.1329 days (3 hours 11 minutes) so the longer light variation they found is about 97.4 per cent of the orbital period. This would be inconsistent with superhumps, which are seen in SU Ursa Majoris stars, but would fit with negative super humps seen also present in disks around cataclysmic stars. Two obvious candidates for causing the flickering are changes in the flow of matter from the larger star onto the disk and variations in the rate that matter falls onto the WD. Pavlenko and Shugaroff suggest another: inhomogenieties in the disk. Longer periodic variations are suspected by others: Pavlenko and Shugaroff (3.9 or 4.67 days) and Skillman et al (3.6 days) report possible detections.
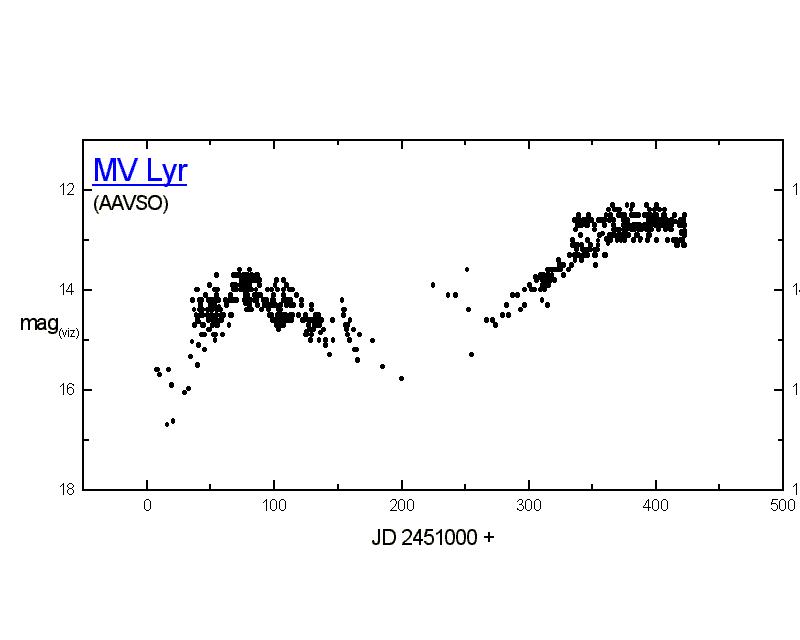
AAVSO visual observations of MV Lyrae over the period JD 2451000 to 2451422, which includes the beginning of the observations here, are shown in Figure 2. These show that the star was at the high state during the observing run, having brightened from a minimum around magnitude 15 about 6 months prior to the observing run. An earlier minimum was fainter, around 18th magnitude, after which it had brightened to 14th magnitude. In addition to the large and relatively slow changes in brightness, there are variations on the order of a few minutes and days, however those are lost in the observational scatter and, more predominantly, rapid variations.
While the changes in brightness over an hour can be a half magnitude, the larger changes in brightness take longer. The star varied by about one magnitude during 50 days covered by this study. Figure 3 shows 33 point averages of the data collected for this investigation. For most of the statistical analyses, the individual data points were used.
Figure 4 presents data from one of the nights used in this analysis. The night chosen for display is typical of the pattern of variations seen. All observations are displayed on pages of the author's web site (http://www.lewcook.com/lewccd.html ) in addition to being archived at CBA. Inspection of the curve shows spikes - variations of several tenths of a magnitude in just a few minutes (flickering) overlying slower, more gentle swings in brightness of similar amplitude which last up to several hours. Further, there are changes in brightness on a time scale of days which also are of several tenths of a magnitude. These are on top of changes in brightness of a few magnitudes in weeks.
In addition to the spikes seen in the light curve, there are underlying quasi periodic variations. Most investigators have found a periodic variation at 47 minutes (0.033 days) . Skillman et al (1995) commented on the transitory nature of the quasi periodic phenomena. This investigation looks at the short term quasi-periodic variations and attempts to determine if they appear at random or if something may be learned from studying them. Perhaps a pattern to them may exist. Because of the large and chaotic changes in brightness and the fact that the overall brightness of the system changed so much, the period of the reported 3 to 5 day variation in brightness cannot be established in the short term. Certainly there are variations which would fit this time scale. In the AAVSO data, the only discernable period is 1.0 day. This may reflect differing comparison star sequences (or observer bias) in different parts of the world. Naturally, the periodogram showed aliases of this at one day intervals, but provided no support for other periodic variations.
Because the CCD observing sessions were all several hours long, there is a reasonable chance of finding periodic variations which have periods less than an hour. Longer periodicities can be studied by combining the data from several nights or of different observers (at differing longitudes) on a single night. This study will look at the longer period phenomena briefly and will concentrate on looking primarily at these shorter period changes. Data from other observers data will be combined, analyzed and reported by CBA later.
To do this analysis, the data were examined using a period searching routine (PDM) in the AVE software package by GEA (Grup d'Estudis Astronomics). Data from each night was subjected to a period search from 0.0005 days to 0.2 days and more closely from 0.0005 day to 0.04 day. There is insufficient repetition of longer period (over 1 hour) variations in a single night for them to be confidently established, so only those periods shorter than one hour were subjected to examination in the single night studies.
The most apparent finding from the period searches is that there are abundant apparent periodicities in the data. Some are mere happenstance: two bright flickers occurring an hour apart will cause a peak in the period search at one hour with a smaller alias peak at one half hour, a smaller one at 1/3 hour and a still smaller peak at 1/4 hour, and so on. Because brief flares are typically seen a few times per hour in MV Lyr, these will cause numerous peaks in periodograms. They may not be representative of strictly periodic phenomena, but rather occur by chance at an interval corresponding to the time between the flares. Another evident finding is that the periodogram constructed from one night's data bears little resemblance to that from another night. Any relationship between periodicities in the light curve of the star from night to night will be subtle if one exists at all.
Data from the period searches was next plotted on one chart: a diagram was constructed in time-and-periodicity-space with dots representing the more prominent peaks in the periodograms. Two different sized dots were used - large dots for prominent peaks in the diagrams with clear variation apparent in the phase diagrams constructed for that period. Smaller dots represent less robust, but still evident peaks in the periodogram. The broader peaks in the periodograms which may represent a quasi periodic variation or a blend of periodicities (and aliases of other periods) are shown by a bar or groups of smaller dots. Because of the great number of peaks present, the least prominent were simply omitted from the diagram.
The diagram (Figure 5) is arranged in a manner similar to rows of spectrograms which are stacked and used to illustrate radial velocity changes in a star system over time. Time (JD) increases from the top to the bottom in this chart with the shorter periods plotted on the left. In this plot, stable periods will show as a vertical line of dots. If long-lived (days) phenomena existed in the disk and moved either inward or outward with a corresponding decrease or increase in the period it would show itself as a slanting line of dots. No overwhelming evidence for either finding is apparent. In fact, with the diagram in Figure 5 resembling cacophonous sheet music, it is possible to support nearly any hypothesis with the data! The writer did get a vague impression that there may be a tendency for a peak on one night to appear at a slightly shorter period the next night. There does seem to be some tendency for some periods (or their aliases) to present themselves on most nights in a casual inspection of Figure 5. When the entire data set is subjected to the period finding test as 33 point averages, these periods do appear to exist, though with amplitudes of 0.10 magnitude and less.
As part of the investigation, phase diagrams (in AVE) were constructed for the larger peaks in the periodograms and they were examined visually. Where obvious periodic variation was found, the period and rough amplitude was noted. Where the periodic variation appeared to be present at twice the noted frequency (i.e. a harmonic frequency was selected), the plot was re-done at the fundamental frequency and the new phase diagram examined. The AVE phase diagrams of the individual observations showed large scatter, consistent with the changes in the underlying variations in brightness of the system over a night.
Next, the 33 point averages of the entire CCD data set were analyzed for periodicity. Several periods were apparent, as were hundreds of aliases. The highest peaks were investigated further by processing the entire data set (not just the 33 point averages) at the period represented by the peaks. This next step was to compute phase diagrams of the entire set of observations for these slightly different periods and visually examine them. With one magnitude of variation in the star, smaller changes would not be noticeable unless the scatter in these phase diagrams were greatly reduced. This was done using an Excel spreadsheet written to calculate an averaged phase diagram. Phase binned 500 observation averages were plotted. This merely required typing in the trial period and another keystroke produced the curve. The period was adjusted within a small range of values near the maximum of the expanded periodogram peak. This way it was quick and easy to vary the trial period until the apparent scatter from a smooth curve diminished. Resulting curves are shown in Figure 6a - 6d. The data in the phase diagrams in Figure 6 is plotted twice (over 2 periods) for clarity of presenting the cyclical nature of the variation. Choice of the beginning point (phase = 0) is arbitrary in all four plots.
The periods found are subject to error through aliasing and simply random variations in the data. The precision indicated in the periods noted below exceeds the soundness of the result. The period listed is the one used to produce an apparent best fitting curve and may not be physically meaningful. Also, a period different by one or more cycles per day or per week (especially for the shorter periods!) may produce an averaged phase curve as good or better than the value found. Furthermore, a periodic phenomenon which was present during a part of the observing run but absent for another portion would appear as a periodic variation of reduced amplitude in the averaged light curves at the original period.
A 0.10 magnitude variation at a period of 0.157875 days was found. A phase diagram of it is presented in Figure 6a. At a 19 per cent excess of the orbital period, this seems too long a period for a superhump period and may be a chance occurrence in the irregular variation of the star. Judging from the shape of the curve, it could be a superposition of several flickers which happened to satisfy a period of some multiples of 227 minutes. There was no peak in the periodograms nor any discernable pattern in phase diagrams at or near the orbital period of 0.1329 days. Another signal at 0.13762 day, near the superhump period detected by Skillman et al (0.1378 day), is also present with an amplitude of 0.08 magnitude (Fig. 6b), and one at 0.13189 days at 0.08 magnitude. An alias of the 0.157875 day peak occurred at 0.13778 d. The other period noted by nearly every investigator, around 48 minutes, is also present at 0.04 magnitude variation at 47.9 minutes (0.0332615 days) shown in Fig. 6c.
 |  |
 |  |
| ||
| Amplitude | ||
| Days | Minutes | (mag.) |
| 0.157875 | 227 | 0.10 |
| 0.13762 | 198 | 0.08 |
| 0.13189 | 190 | 0.08 |
| 0.0332615 | 47.9 | 0.04 |
| 0.014131 | 20.3 | 0.02 |
| 0.0094245 | 13.6 | 0.02 |
| 0.0056075 | 8.07 | 0.02 |
| 0.0036363 | 5.23 | 0.02 |
One fairly short period which did seem weakly present is a signal at 0.003636 days (5.23 minutes) in a subset of the observing run, the four nights JD 2451424.6-2451429.9. A phase diagram at this frequency showed a sine shaped curve with a full amplitude of 0.02 magnitude. When the entire data set was processed with this period, the amplitude nearly vanished and was questionably there at 0.007 magnitude. However, adjusting the period to 0.0036363 days (1.13 cycles over 50 days) restored the curve in the entire data set. The phase diagram on this period is shown in Figure 6d. This period is on the order of white dwarf rotational periods, and this is suggested as a possible cause.
The author thanks the AAVSO for the visual light curve of MV Lyrae over the period JD 2451000-2451422. The dedication of their volunteer observers who observed MV Lyrae is sincerely appreciated. The period searching software in the program AVE developed by Rafael Barbera of GEA, in Spain, enabled hundreds of periodograms and phase diagrams to be calculated and examined in only a few hours. AVE is freely available on the WWW ( http://www.astrogea.org/soft/ave/aveint.htm ). Also worthy of high praise is the work Richard Berry performed in development of the Photomet software. Assistance of Jonathan Kemp of CBA also helped greatly in the preparation of the paper.
Berry, R.; Kanto, V; Munger, J.1994, CCD Camera Cookbook, Willmann Bell, Richmond, VA.
Borisov, G. V. 1992, A&A, 261, 154.
Kraicheva, Z., Stanishev, V., and Genkov, V. 1999, A&AS 134, 263.
Patterson, J., Kemp, J., Skillman, D., Harvey, D., Shafter, A, Vanmunster, T., Jensen, L., Fried, R., Kiyota, S., Thorstensen, J.,and Taylor, C., 1998, PASP 110, 1290.
Pavlenko, E. P.; Shugarov, S. Yu. 1999, A&A 343, 909.
Shugarov, S. Yu.; Pavlenko, E. P. 1998, Astronomy Reports 42, 370.
Skillman, D. R., J. Patterson and J. R. Thorstensen, J. R. 1995, PASP 107, 545.
Figure 2. AAVSO observations of MV Lyrae.
Figure 3. Averaged observations of MV Lyrae.
Figure 4. Individual observations on a typical night - JD 2451427.7.
Figure 5. Nightly periodogram analysis peaks.
Figure 6. Phase diagrams for notable periodic variations found.
(a) 227 minutes - an artifact of flickering?
(b) 198 minutes - possible superhump period
(c) 48 minutes - persistent for several years
(d) 5.23 minutes - possible white dwarf spin period