These light curves were collected on March 31, April 1, 2 and 8, 2000 (UT). The data on April 8 was affected by wind which caused deterioration in some images, resulting in poorer statistics in the data.
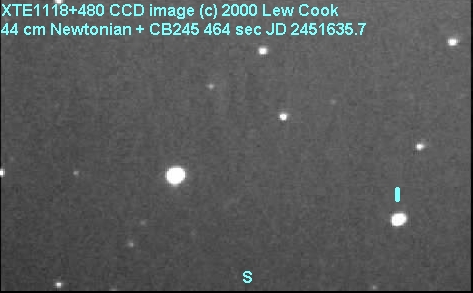  |
Figure 1
The brightest star is GSC 3451:1612 at
V = 10.963 and (B-V)= 0.517 by Arne Henden
of the USNO Observatory at Flagstaff.
The CCD(Instrumental) magnitude is ~10.70
in the CBA California system.
The phase diagram on the right is also shown in larger scale below.
|
Figure 2. Observations of XTE J1118+480 as 10 point averages on the first 3 nights.
|
Figure 3. Phase diagram for a period of 0.171 days based on all individual point (4 nights) data.
|
|
Figure 4. CCD Observations from April 1, 2000.
|
Figure 5. CCD Observations from April 2, 2000 shown as 10 frame averages.
|
Figure 6. PDM Analysis of 3 nights data showing a prominent
peak at 0.170 days and several aliases.
|
Figure 7. Observations from April 8, 2000 where windy conditions caused
some scatter due to vibration of the telescope.
|
Figure 8. 50 point averaged phase diagram
(plot repeated over 2 cycles for clarity).
The data were sorted by phase based on Patterson's ephemeris
maximum light = HJD2451634.835 + 0.1706 E
and averaged in groups of 50.
The amplitude of 0.06 magnitude agrees
with that found by Joe Patterson.
The IAU Circular announcing this discovery is available on the WWW.
The CBAT WWW policy on distribution of IAU Circulars details restrictions on distribution of the circulars.
|
Figure 9. Observations from April 15, 2000 where clouds halted data collection after just over an hour of observing.
|
Figure 10. Observations from April 23, 2000. The 0.1708 day periodicity is still there and the star is still bright!
|
Figure 11. PDM Theta diagram from periods of 0.17 d to 0.1715d. By eyeball, the period of 0.170818 d is chosen.
|
Figure 12. A phase diagram of the 6 nights data. There is a solid consistency in the diagrams shown in Figure 3 and Figure 12.
|
Figure 13. Observations from April 29, 2000. The 0.1708 day periodicity is still there but the star is becoming more quiet but the star is still bright! Has the shape of the light curve changed slightly?
|
Figure 14. Observations from April 30, 2000. The 0.1708 day periodicity is still there but the shape of the light curve still seems to be different than in early April (slower decline, steeper rise).
|
Figure 15. Phase Diagram for observations on April 29 and 30, 2000 shows a decidedly different shape in the light curve.
|
Figure 16. Averaged Phase Diagram for observations on April 29 and 30, 2000 at the period 0.1708 days.
|
Figure 17. Phase Diagram for observations on May 22, 2000 shows a decidedly different shape in the light curve - the increase in brightness is now slow and the decline is rapid, just the reverse of the behavior in the earlier curve (Figure 16).
|